
Programs comparing candidates, dose, time or combinations to establish a basis for prioritization.
R&D service
Organoid efficacy screening
Compare single agents, dose responses and combinations in selected organoid models to identify dose-dependent and model-specific candidate responses.
 View image
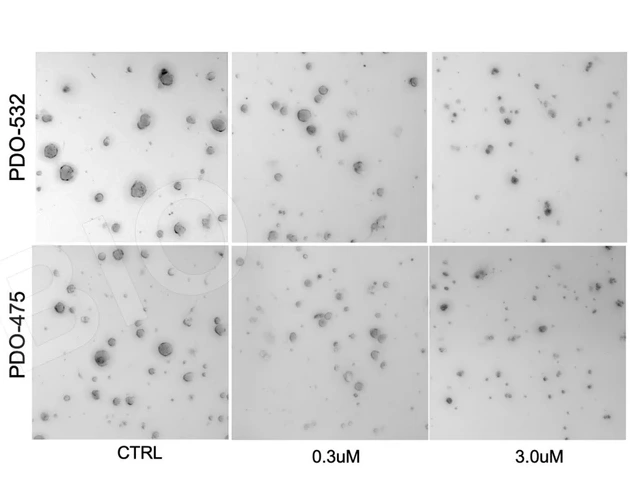
Breast cancer PDOs · plate-based ADC study
Establish a plate-based baseline with ADC dose response, then extend to candidate comparison
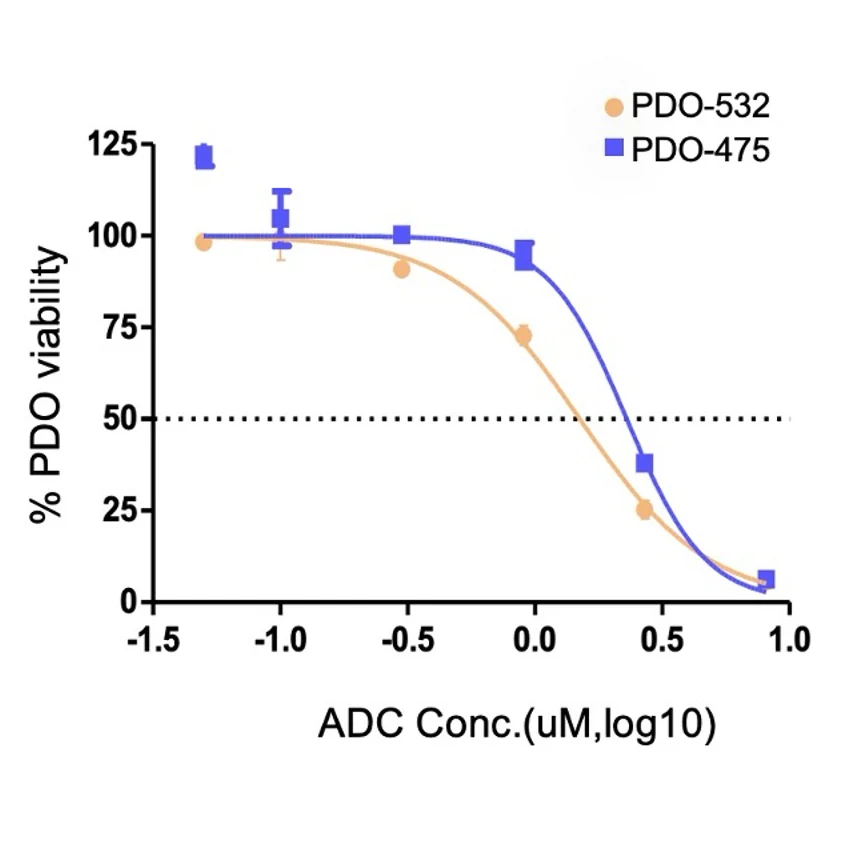
This ADC study illustrates a plate-based workflow across two breast cancer PDO models, comparing control and dose conditions with model-specific response curves. The same design can be adapted to small molecules, combinations and other modalities, with endpoints selected for their mechanism.
Study focus
What this study can help you decide
- 01How does response change across dose?
- 02What does the combination add over either single agent?
- 03How does response vary across models or samples?
STUDY APPROACH
Match the model and assays to your program
Conventional PDOs suit many tumor-epithelial efficacy comparisons; assess PDO 2.0 or a relevant co-culture when tissue, immune or spatial context is central.
Combine viability, morphology, apoptosis, imaging and mechanism-linked endpoints around the candidate modality and expected differences.
Define vehicle and positive controls, replication, assay window and prespecified comparison or hit criteria.
Prioritize candidates, dose windows and combinations, then define the next orthogonal or mechanism study.
Study workflow
Compare and rank candidates in consistent organoid studies
Confirm model batch quality, assay window and readout stability, then design dose, timing, combinations and mechanism-linked endpoints to produce comparable screening results.
Screen objective and candidate tiers
Define primary screening, confirmation, dose ranking or combination comparison, then stage the work by modality, candidate count and available evidence.
Model batch and assay window
Confirm identity, viability, well-to-well consistency, vehicle tolerance and positive-control response before expanding the screen.
Dose, combinations and multimodal readouts
Use single-agent dose series, combination matrices or longitudinal observation, interpreting viability alongside morphology, apoptosis, imaging or molecular readouts.
Confirmation and candidate ranking
Confirm preliminary hits with independent repeats or complementary endpoints, then rank candidates using potency, maximum effect, selectivity and data quality.
Study images and readouts
Compare candidates through morphology and dose response
This plate-based ADC study uses morphology and dose-response curves to compare two breast cancer PDO models, informing dose range, replication and follow-on model selection.
 View image
ADC dose response: candidate concentration is plotted against response in two breast cancer PDO models to compare model differences, define follow-up dose ranges and plan replication.
TRiCBIO breast cancer PDO ADC study dataView antibody distribution and ADC responseExpected study outputs
What you receive
Comparable response curves
Single agents, dose series or combination matrices use consistent experimental and analytical criteria.
Mechanism-linked readouts
An integrated analysis of viability, morphology, imaging, molecular or secreted readouts selected around the mechanism of action.
A traceable study report
Experimental conditions, model QC, raw data, analysis methods and key findings in a single study report.
Relevant model systems
Recommended model systems
Plate format and study scale are adapted to the model, candidate count and endpoints, with sample count, replicates, assay window and evaluation criteria defined before the study begins.
PROJECT DISCUSSION
Plan an organoid efficacy study
Bring the candidate set, dose or combination plan, intended models and key endpoints. We’ll define the plate format, controls, replicates and comparison strategy with you.