01Model confirmation
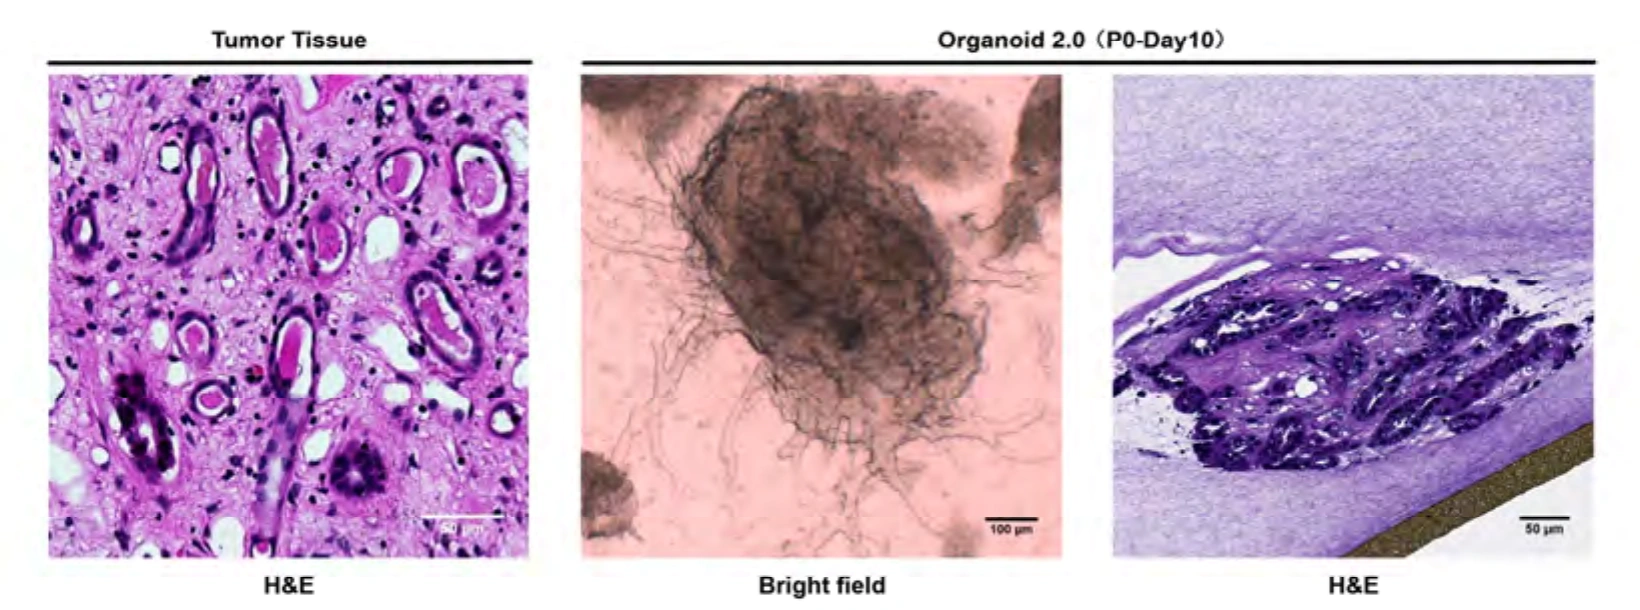
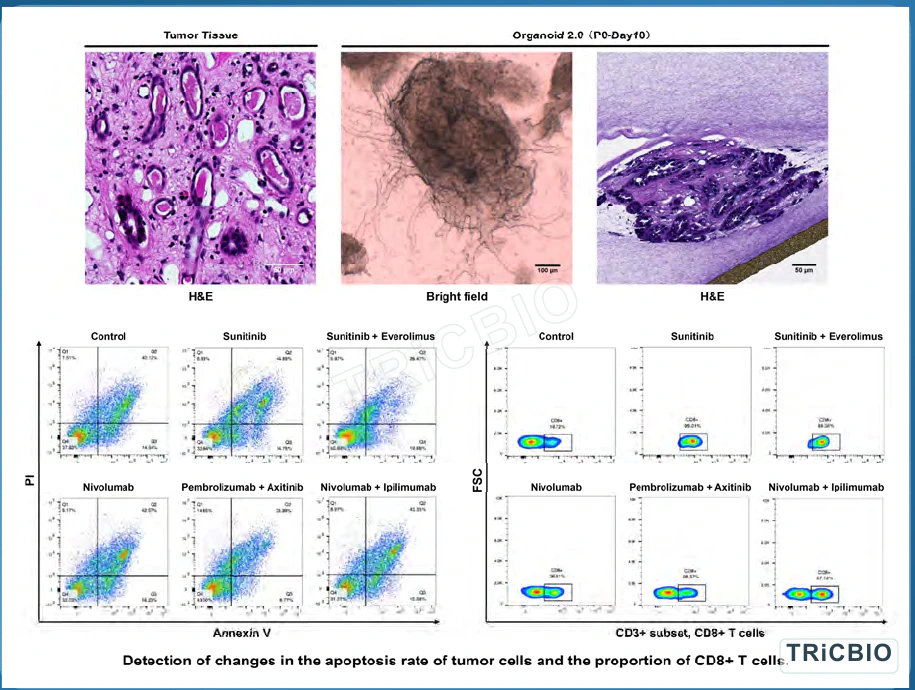
Tumor tissue, PDO bright-field and PDO H&E
Source tissue and PDO views establish histological context before treatment experiments.
Sets the histological baseline for treatment comparisonSource-tissue/PDO histology establishes model context; Annexin V/PI and CD3/CD8 flow compare apoptosis and immune change across treatment conditions.
STUDY EVIDENCE
Tumor tissue–PDO comparison establishes model context, while Annexin V/PI and CD3/CD8 flow cytometry show cell-death and immune changes across treatment conditions.
Source tissue and PDO views establish histological context before treatment experiments.
Sets the histological baseline for treatment comparison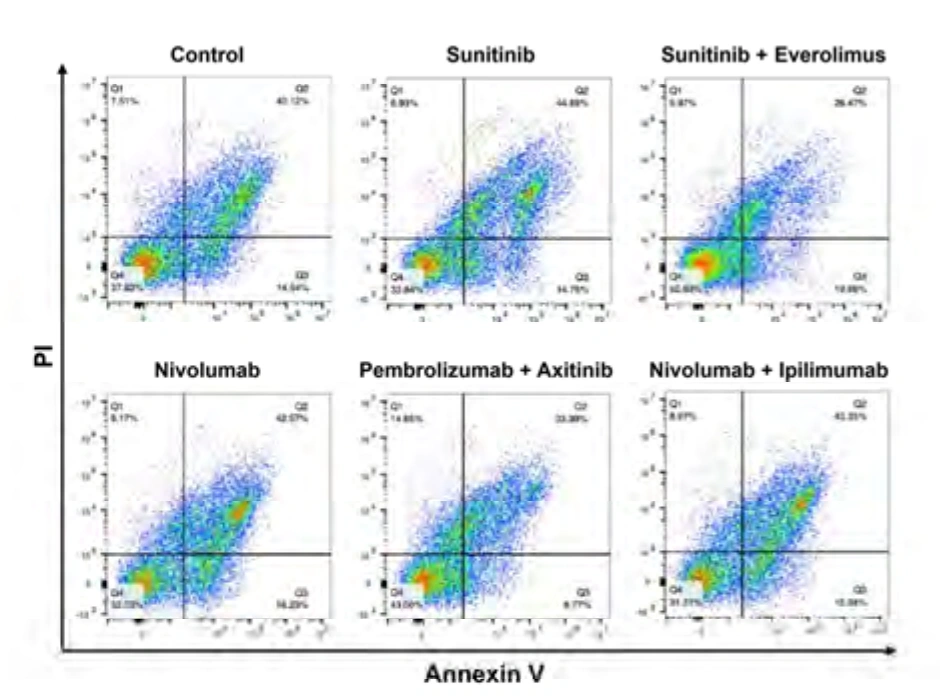
Flow plots show Annexin V/PI distributions under control, targeted, immune and combination conditions.
Guides replication and additional cell-death endpoint design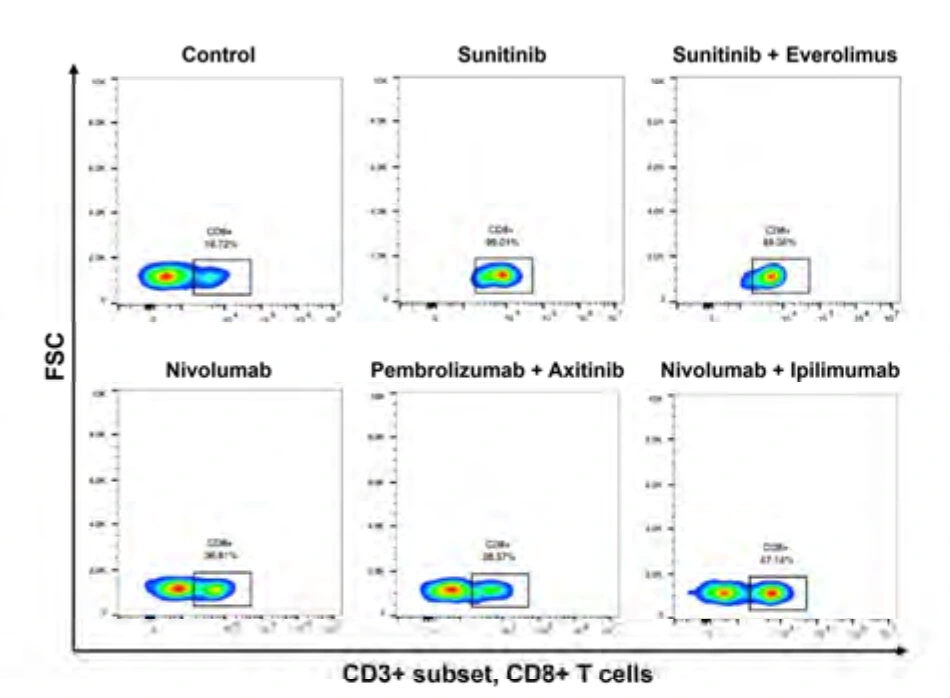
Flow plots under the same treatment conditions show changes in CD8-positive cells within the CD3+ subset alongside apoptosis readouts.
Adds an immune dimension to treatment comparisonINTERPRETATION
Annexin V/PI and CD3/CD8 flow readouts compare apoptosis and T-cell changes across treatments.
Treatment comparisons are interpreted within the study's sample background, dose, exposure time and controls.
Compare dose and time-course effects, then deepen validation with mechanism endpoints and independent samples.
Related models and services
Study planning
Candidate comparison and mechanism studies
Candidates, dosing conditions, controls and sample pathology
Model confirmation, treatment execution, apoptosis and immune flow assays
Study records, flow and histology images, comparative analysis and report
Plan follow-on dose, mechanism and additional-sample studies
Dose, timing, sample context, replication and flow gating
PROJECT DISCUSSION
Tell us which model, assay or finding you want to extend. Our scientists will adapt the approach to your candidate, samples and decision point.
Source-tissue/PDO histology establishes model context; Annexin V/PI and CD3/CD8 flow compare apoptosis and immune change across treatment conditions.
STUDY EVIDENCE
Tumor tissue–PDO comparison establishes model context, while Annexin V/PI and CD3/CD8 flow cytometry show cell-death and immune changes across treatment conditions.
Source tissue and PDO views establish histological context before treatment experiments.
Sets the histological baseline for treatment comparisonFlow plots show Annexin V/PI distributions under control, targeted, immune and combination conditions.
Guides replication and additional cell-death endpoint designFlow plots under the same treatment conditions show changes in CD8-positive cells within the CD3+ subset alongside apoptosis readouts.
Adds an immune dimension to treatment comparisonINTERPRETATION
Annexin V/PI and CD3/CD8 flow readouts compare apoptosis and T-cell changes across treatments.
Treatment comparisons are interpreted within the study's sample background, dose, exposure time and controls.
Compare dose and time-course effects, then deepen validation with mechanism endpoints and independent samples.
Related models and services
Study planning
Candidate comparison and mechanism studies
Candidates, dosing conditions, controls and sample pathology
Model confirmation, treatment execution, apoptosis and immune flow assays
Study records, flow and histology images, comparative analysis and report
Plan follow-on dose, mechanism and additional-sample studies
Dose, timing, sample context, replication and flow gating
PROJECT DISCUSSION
Tell us which model, assay or finding you want to extend. Our scientists will adapt the approach to your candidate, samples and decision point.