TRiCBIO
EvidenceNavigation menu
R&D ServicesModels & ProductsApplicationsTechnologyEvidence & ResourcesHow We WorkAbout TRiCBIOProject inquiry中文
Study resultsStudy data

PDO 2.0 tumor–immune response

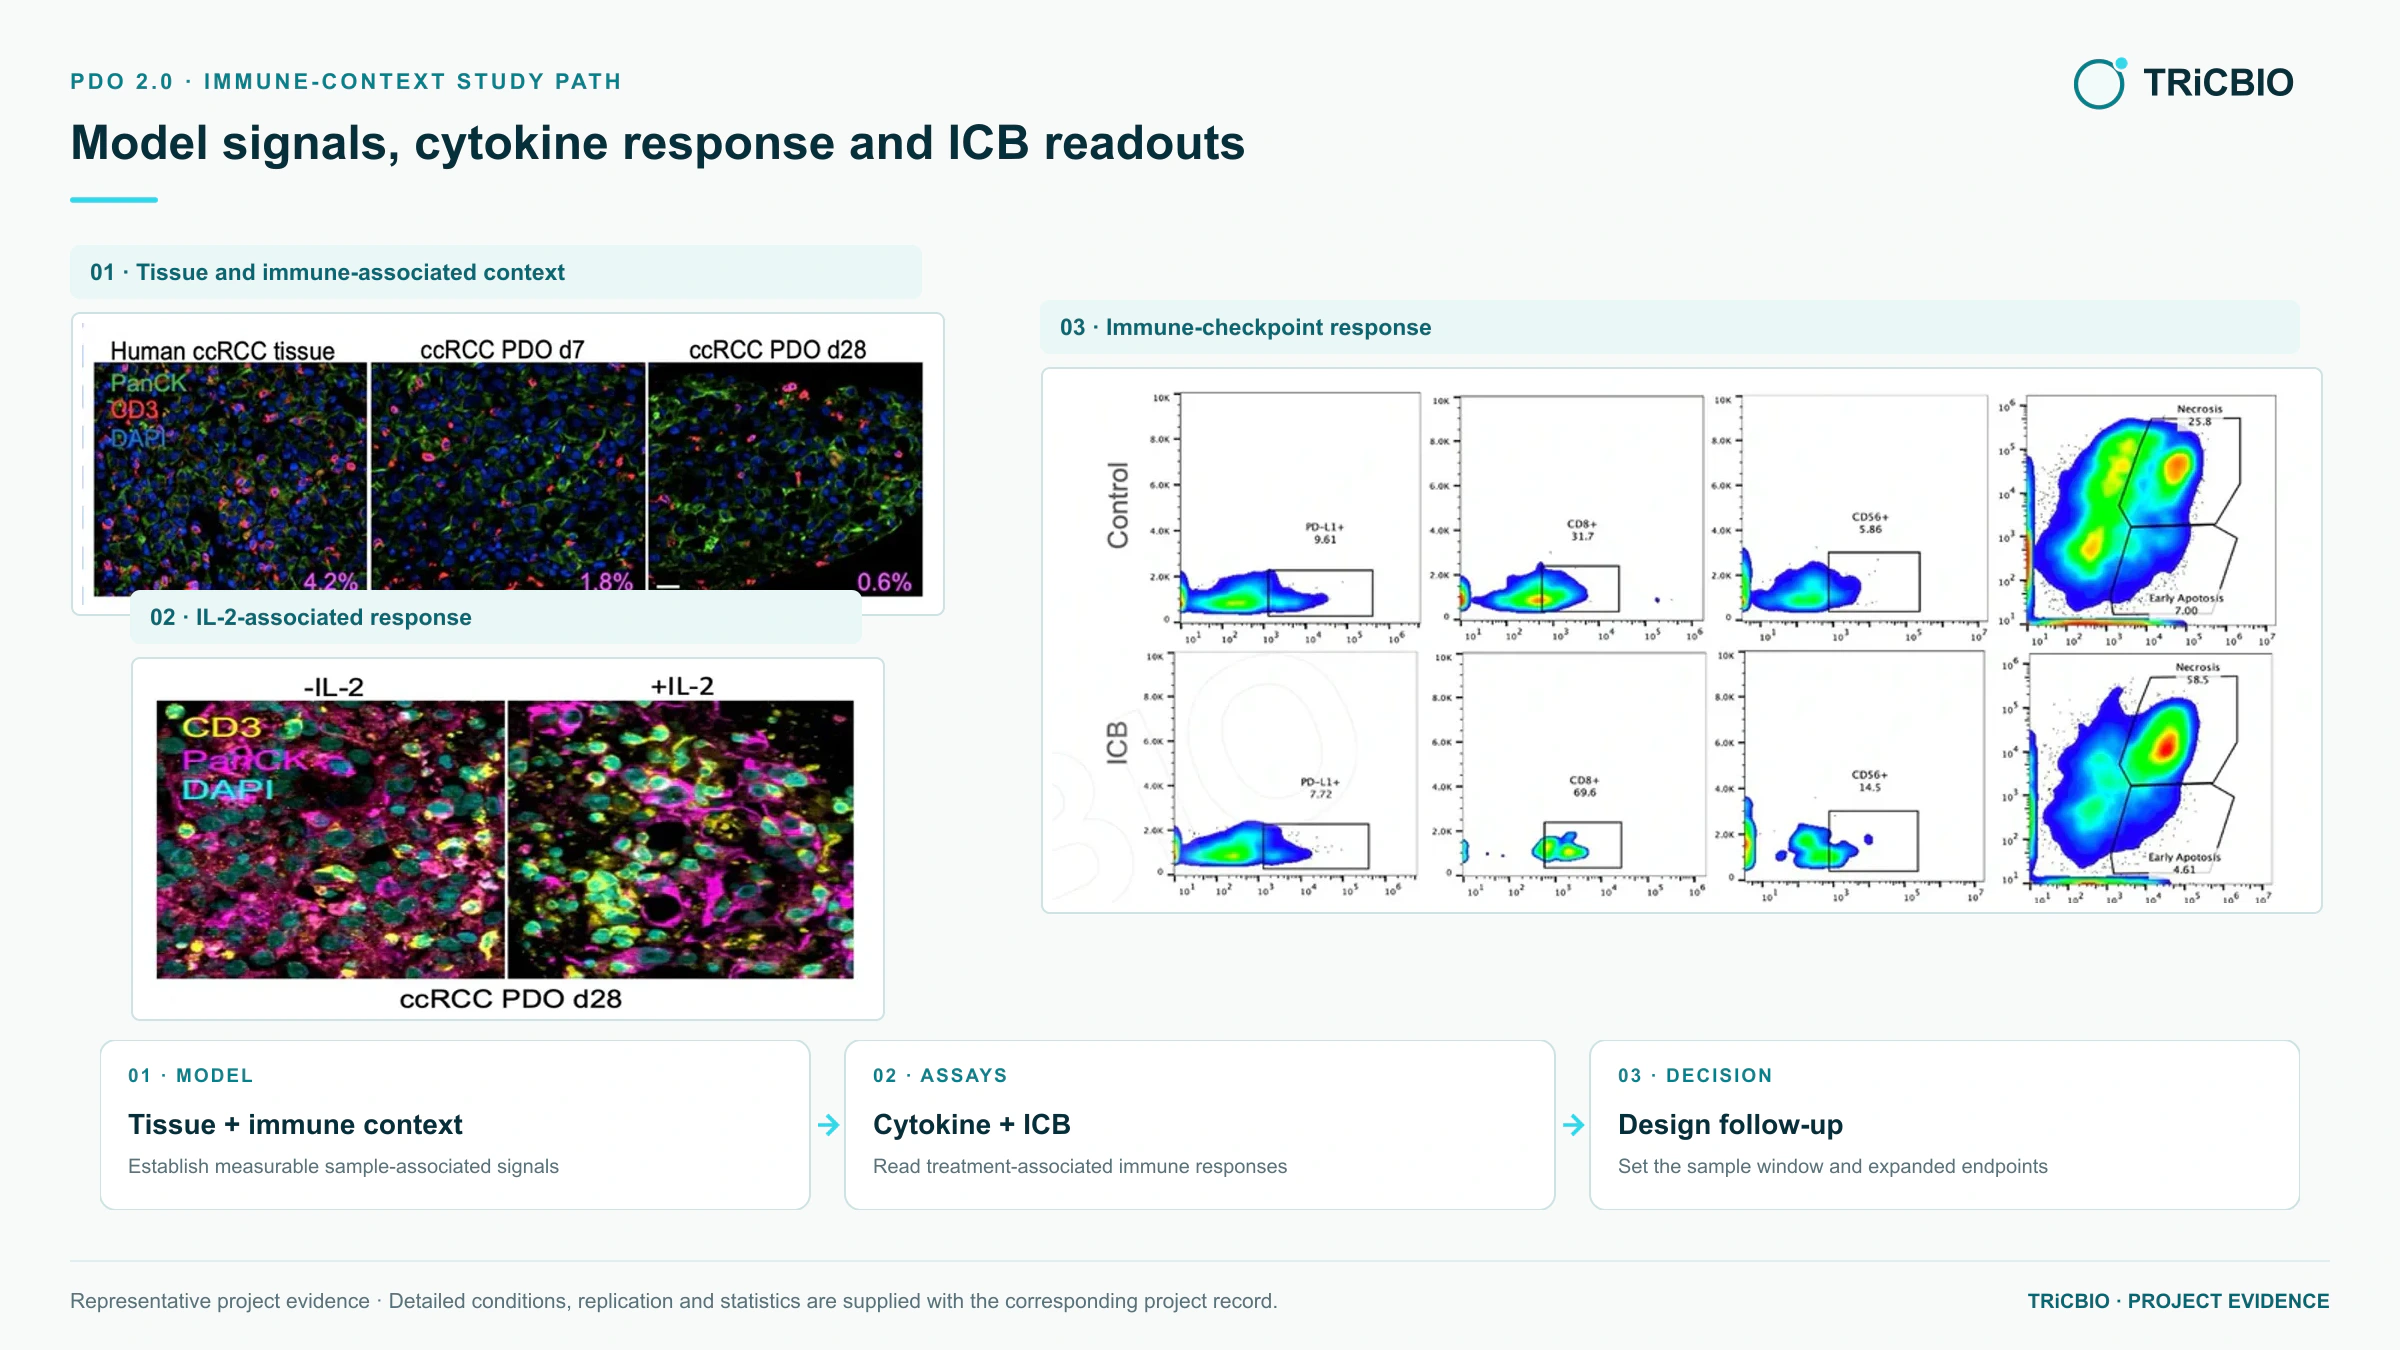
TRiCBIO PDO 2.0 studies in clear-cell renal cell carcinoma (ccRCC) and non-small-cell lung cancer (NSCLC) combine tissue identity, immune baseline and treatment-response readouts to guide immuno-oncology study design.

01Study objective02Model & design03Assays & findings04Decision & next step
Model & sampleccRCC and NSCLC PDO 2.0 study models
ObjectiveCombine ccRCC tissue and ICB-associated cell-death readouts with NSCLC T-cell culture data to show the multidimensional assay paths available for PDO 2.0 immune studies.
Study conditionsIL-2 and immune-checkpoint study conditions
AssaysccRCC: PanCK, CD3, PD-L1, CD8, CD56 and apoptosis/necrosis flow; NSCLC: CD4/CD8 counts within CD3-positive TILs.
Study evidenceTRiCBIO study data and figures
DeliverablesReceive images, assay results and an analysis summary; the report documents the study design, sample size and statistical methods

STUDY AND RESULTS

From baseline context to immune response and treatment-related cell-death readouts

Tissue baseline, immune stimulation and treatment-response readouts offer complementary views for tumor–immune studies.

01Tissue and model context
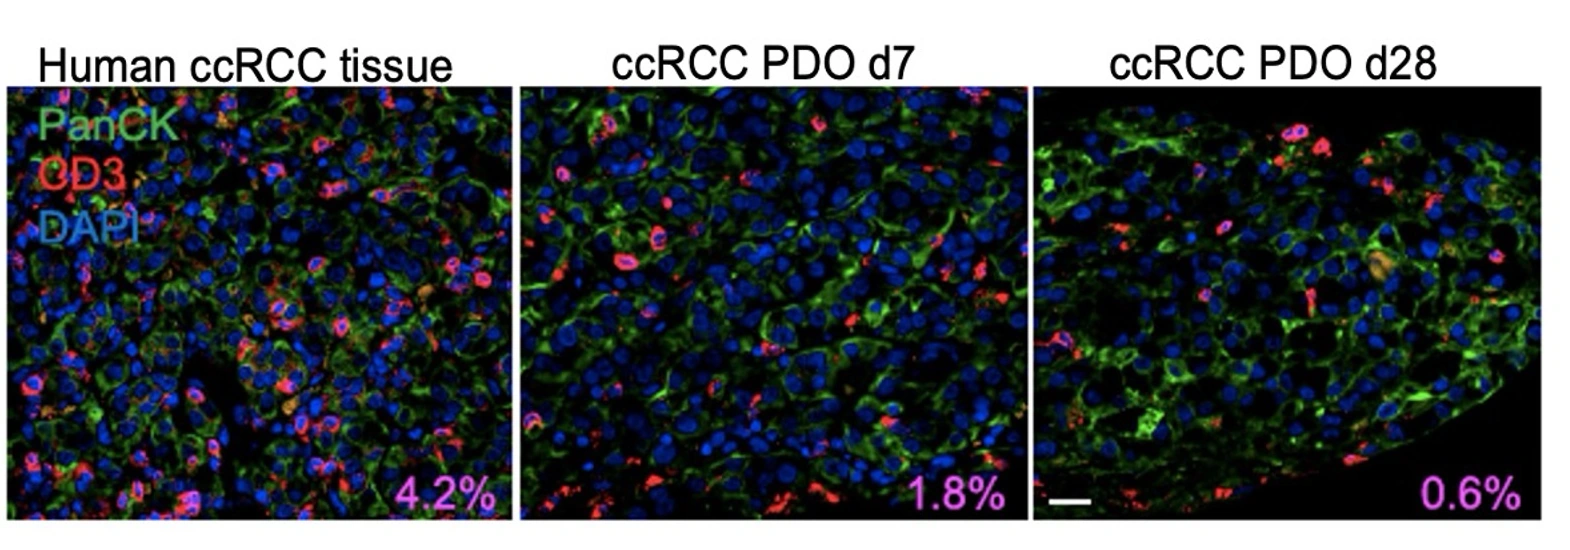
Tissue and model context | PDO 2.0 TME study imageView image
Source tissue · PDO d7 · PDO d28 | PanCK · CD3 · DAPI

Compare tumor-epithelial and sample-associated immune signals

Source tissue and PDOs at days 7 and 28 show PanCK, CD3 and DAPI signals side by side for comparison of tumor-epithelial and sample-associated immune signals.

Provides baseline data for immune quantification and treatment studies
02Stimulation response
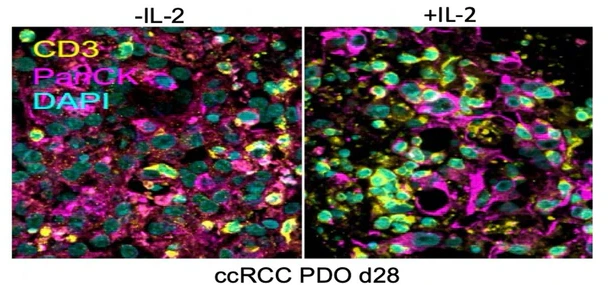
Stimulation response | PDO 2.0 TME study imageView image
±IL-2 | CD3 · PanCK · DAPI

Test the response to immune stimulation

Tissue imaging under ±IL-2 conditions shows the response to stimulation and can be combined with subsequent flow and cytokine assays.

Informs dose, time-point and cytokine-endpoint selection
03Treatment response
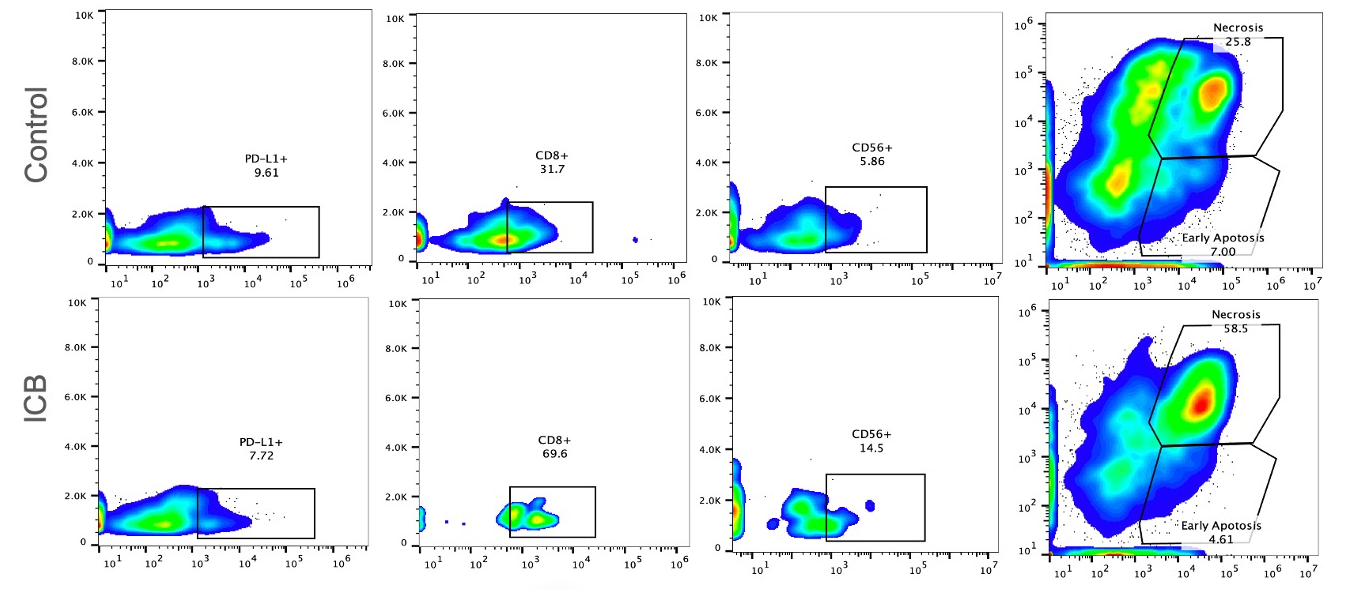
Treatment response | PDO 2.0 TME study imageView image
Control vs immune checkpoint blockade (ICB) | PD-L1 · CD8 · CD56 · apoptosis/necrosis

Connect immune-cell changes with cell-death readouts

PD-L1-, CD8- and CD56-associated flow profiles are interpreted alongside early-apoptosis and necrosis readouts to compare immune-associated and cell-death changes under ICB conditions.

Informs candidate and independent-sample comparisons
View the complete study figure set
ccRCC tissue and PDO culture characterization, IL-2 stimulation and ICB-related flow readouts in PDO 2.0View image
The complete figure set for tissue and culture context, IL-2 stimulation and ICB-related flow readouts.

IMAGING & FLOW ASSAYS

Use imaging and flow results to select the model, treatment conditions and assays

Study stageMeasured endpointsHow results inform your programStudy extensions
01Source tissue + PDO d7/d28

PanCK, CD3, DAPI and tissue morphology

Measurable tumor context and immune signals

Multi-field quantification, replication and sample-specific windows

02±IL-2 conditions

CD3, PanCK and DAPI immunofluorescence

Interpretable change after immune stimulation

Dose/time, cytokine and gating analyses

03Control + ICB conditions

PD-L1-, CD8- and CD56-associated flow profiles with apoptosis and necrosis

Relationship between immune change and cell-death readouts

Candidate mechanism, target context and independent-sample comparisons

NEXT PROGRAM DECISIONS

Plan candidate and dose comparisons and confirmation in independent samples

Use immune-cell profiles and treatment responses to design the next candidate, dose and independent-sample study.

HOW THE STUDY IS BUILT

Compare immune and cell-death changes across treatment conditions

Sample baseline informs the culture window, flow-cytometry gating and replication design so immune and cell-death-related changes can be compared clearly across treatment conditions.

INTERPRETATION

Use TME readouts to refine treatment studies

How the results are used

Select histology, cell-death and T-cell profiling endpoints for immunotherapy studies across different sample contexts.

Study application

Programs select the observation window and assay panel from each sample's immune baseline and culture state, then extend the study through replication and additional samples.

Follow-on study

Set dose, time, cytokine and flow analyses around the candidate mechanism, then compare responses across replicates and independent samples.

Related models and services

Choose the right models and services for the next study

PROJECT DISCUSSION

Discuss a study built around your program

Tell us which model, assay or finding you want to extend. Our scientists will adapt the approach to your candidate, samples and decision point.